Blog

  • Earth Atmosphere

    The atmosphere of Earth is composed of a layer of gas mixture that surrounds the Earth‘s planetary surface (both lands and oceans), known collectively as air, with variable quantities of suspended aerosols and particulates (which create weather features such as clouds and hazes), all retained by Earth’s gravity. The atmosphere serves as a protective buffer between the Earth’s surface and outer space, shields the surface from most meteoroids and ultraviolet solar radiation, keeps it warm and reduces diurnal temperature variation (temperature extremes between day and night) through heat retention (greenhouse effect), redistributes heat and moisture among different regions via air currents, and provides the chemical and climate conditions allowing life to exist and evolve on Earth.

    By mole fraction (i.e., by quantity of molecules), dry air contains 78.08% nitrogen, 20.95% oxygen, 0.93% argon, 0.04% carbon dioxide, and small amounts of other trace gases (see Composition below for more detail). Air also contains a variable amount of water vapor, on average around 1% at sea level, and 0.4% over the entire atmosphere.

    Earth’s early atmosphere consisted of accreted gases from the solar nebula, but the atmosphere changed significantly over time, affected by many factors such as volcanismimpact eventsweathering and the evolution of life (particularly the photoautotrophs). Recently, human activity has also contributed to atmospheric changes, such as climate change (mainly through deforestation and fossil fuel-related global warming), ozone depletion and acid deposition.

    The atmosphere has a mass of about 5.15×10¹⁸ kg,[2] three quarters of which is within about 11 km (6.8 mi; 36,000 ft) of the surface. The atmosphere becomes thinner with increasing altitude, with no definite boundary between the atmosphere and outer space. The Kármán line, at 100 km (62 mi) or 1.57% of Earth’s radius, is often used as the border between the atmosphere and outer space. Atmospheric effects become noticeable during atmospheric reentry of spacecraft at an altitude of around 120 km (75 mi). Several layers can be distinguished in the atmosphere based on characteristics such as temperature and composition, namely the tropospherestratospheremesospherethermosphere (formally the ionosphere) and exosphere. Air composition, temperature and atmospheric pressure vary with altitude. Air suitable for use in photosynthesis by terrestrial plants and respiration of terrestrial animals is found within the troposphere.[3]

    The study of Earth’s atmosphere and its processes is called atmospheric science (aerology), and includes multiple subfields, such as climatology and atmospheric physics. Early pioneers in the field include Léon Teisserenc de Bort and Richard Assmann.[4] The study of historic atmosphere is called paleoclimatology.

    Composition

    Main article: Atmospheric chemistry

    Composition of Earth’s atmosphere by molecular count, excluding water vapor. Lower pie represents trace gases that together compose about 0.0434% of the atmosphere.[5][6][7]

    The three major constituents of Earth’s atmosphere are nitrogenoxygen, and argon. Water vapor accounts for roughly 0.25% of the atmosphere by mass. The concentration of water vapor (a greenhouse gas) varies significantly from around 10 ppm by mole fraction in the coldest portions of the atmosphere to as much as 5% by mole fraction in hot, humid air masses, and concentrations of other atmospheric gases are typically quoted in terms of dry air (without water vapor).[8]: 8  The remaining gases are often referred to as trace gases,[9] among which are other greenhouse gases, principally carbon dioxide, methane, nitrous oxide, and ozone. Besides argon, other noble gasesneonheliumkrypton, and xenon are also present. Filtered air includes trace amounts of many other chemical compounds. Many substances of natural origin may be present in locally and seasonally variable small amounts as aerosols in an unfiltered air sample, including dust of mineral and organic composition, pollen and sporessea spray, and volcanic ash. Various industrial pollutants also may be present as gases or aerosols, such as chlorine (elemental or in compounds), fluorine compounds and elemental mercury vapor. Sulfur compounds such as hydrogen sulfide and sulfur dioxide (SO2) may be derived from natural sources or from industrial air pollution.

    The volume fraction of the main constituents of the Earth’s atmosphere as a function of height, based on the MSIS-E-90 atmospheric model; the model only works above 85 km
    Dry air
    GasVolume fraction(A)Mass fraction
    NameFormulain ppm(B)in %in ppmin %
    NitrogenN2780,80078.08755,20075.52
    OxygenO2209,50020.95231,40023.14
    ArgonAr9,3400.934012,9001.29
    Carbon dioxide[6]CO24120.04126260.063
    NeonNe18.20.0018212.70.00127
    HeliumHe5.240.0005240.7240.0000724
    Methane[7]CH41.790.0001790.990.000099
    KryptonKr1.140.0001143.30.00033
    If air is not dry:
    Water vapor(D)H2O0–30,000(D)0–3%(E)
    The total ppm above adds up to more than 1 million (currently 83.43 above it) due to experimental error.
    Notes
    (A) In the atmosphere the pressure is low enough for the ideal gas laws to be correct within 1%. Therefore the mole fraction is very close to the volume fraction.[10]: 4 
    (B) ppm: parts per million by molecular count
    (C) The concentration of CO2 has been increasing in recent decades, as has that of CH4.
    (D) Water vapor is about 0.25% by mass over full atmosphere
    (E) Water vapor varies significantly locally[8]

    The average molecular weight of dry air, which can be used to calculate densities or to convert between mole fraction and mass fraction, is about 28.946[11] or 28.964[12][5] g/mol. This is decreased when the air is humid.

    The relative concentration of gases remains constant until about 10,000 m (33,000 ft).[13]

    Stratification

    Earth’s atmosphere. Lower four layers of the atmosphere in three dimensions as seen diagonally from above the exobase. Layers drawn to scale, objects within the layers are not to scale. Aurorae shown at the bottom of the thermosphere can form at any altitude within this layer.

    In general, air pressure and density decrease with altitude in the atmosphere. However, temperature has a more complicated profile with altitude and may remain relatively constant or even increase with altitude in some regions (see the temperature section). Because the general pattern of the temperature/altitude profile, or lapse rate, is constant and measurable by means of instrumented balloon soundings, the temperature behavior provides a useful metric to distinguish atmospheric layers. This atmospheric stratification divides the Earth’s atmosphere into five main layers:[14]

    • Exosphere: 700–10,000 km (435–6,214 mi)[15]
    • Thermosphere: 80–700 km (50–435 mi)[16]
    • Mesosphere: 50–80 km (31–50 mi)
    • Stratosphere: 12–50 km (7–31 mi)
    • Troposphere: 0–12 km (0–7 mi)[17]

    Exosphere

    Main article: Exosphere

    The exosphere is the outermost layer of Earth’s atmosphere (though it is so tenuous that some scientists consider it to be part of interplanetary space rather than part of the atmosphere). It extends from the thermopause (also known as the “exobase”) at the top of the thermosphere to a poorly defined boundary with the solar wind and interplanetary medium. The altitude of the exobase varies from about 500 kilometres (310 mi; 1,600,000 ft) to about 1,000 kilometres (620 mi) in times of higher incoming solar radiation.[18]

    The upper limit varies depending on the definition. Various authorities consider it to end at about 10,000 kilometres (6,200 mi)[19] or about 190,000 kilometres (120,000 mi)—about halfway to the moon, where the influence of Earth’s gravity is about the same as radiation pressure from sunlight.[18] The geocorona visible in the far ultraviolet (caused by neutral hydrogen) extends to at least 100,000 kilometres (62,000 mi).[18]

    This layer is mainly composed of extremely low densities of hydrogen, helium and several heavier molecules including nitrogen, oxygen and carbon dioxide closer to the exobase. The atoms and molecules are so far apart that they can travel hundreds of kilometres without colliding with one another. Thus, the exosphere no longer behaves like a gas, and the particles constantly escape into space. These free-moving particles follow ballistic trajectories and may migrate in and out of the magnetosphere or the solar wind. Every second, the Earth loses about 3 kg of hydrogen, 50 g of helium, and much smaller amounts of other constituents.[20]

    The exosphere is too far above Earth for meteorological phenomena to be possible. However, Earth’s auroras—the aurora borealis (northern lights) and aurora australis (southern lights)—sometimes occur in the lower part of the exosphere, where they overlap into the thermosphere. The exosphere contains many of the artificial satellites that orbit Earth.

    Thermosphere

    Main article: Thermosphere

    The thermosphere is the second-highest layer of Earth’s atmosphere. It extends from the mesopause (which separates it from the mesosphere) at an altitude of about 80 km (50 mi; 260,000 ft) up to the thermopause at an altitude range of 500–1000 km (310–620 mi; 1,600,000–3,300,000 ft). The height of the thermopause varies considerably due to changes in solar activity.[16] Because the thermopause lies at the lower boundary of the exosphere, it is also referred to as the exobase. The lower part of the thermosphere, from 80 to 550 kilometres (50 to 342 mi) above Earth’s surface, contains the ionosphere.

    The temperature of the thermosphere gradually increases with height and can rise as high as 1500 °C (2700 °F), though the gas molecules are so far apart that its temperature in the usual sense is not very meaningful. The air is so rarefied that an individual molecule (of oxygen, for example) travels an average of 1 kilometre (0.62 mi; 3300 ft) between collisions with other molecules.[21] Although the thermosphere has a high proportion of molecules with high energy, it would not feel hot to a human in direct contact, because its density is too low to conduct a significant amount of energy to or from the skin.

    This layer is completely cloudless and free of water vapor. However, non-hydrometeorological phenomena such as the aurora borealis and aurora australis are occasionally seen in the thermosphere. The International Space Station orbits in this layer, between 350 and 420 km (220 and 260 mi). It is this layer where many of the satellites orbiting the Earth are present.

    Mesosphere

    Main article: Mesosphere

    Afterglow of the troposphere (orange), the stratosphere (blue) and the mesosphere (dark) at which atmospheric entry begins, leaving smoke trails, such as in this case of a spacecraft reentry

    The mesosphere is the third highest layer of Earth’s atmosphere, occupying the region above the stratosphere and below the thermosphere. It extends from the stratopause at an altitude of about 50 km (31 mi; 160,000 ft) to the mesopause at 80–85 km (50–53 mi; 260,000–280,000 ft) above sea level.

    Temperatures drop with increasing altitude to the mesopause that marks the top of this middle layer of the atmosphere. It is the coldest place on Earth and has an average temperature around −85 °C (−120 °F; 190 K).[22][23]

    Just below the mesopause, the air is so cold that even the very scarce water vapor at this altitude can condense into polar-mesospheric noctilucent clouds of ice particles. These are the highest clouds in the atmosphere and may be visible to the naked eye if sunlight reflects off them about an hour or two after sunset or similarly before sunrise. They are most readily visible when the Sun is around 4 to 16 degrees below the horizon. Lightning-induced discharges known as transient luminous events (TLEs) occasionally form in the mesosphere above tropospheric thunderclouds. The mesosphere is also the layer where most meteors burn up upon atmospheric entrance. It is too high above Earth to be accessible to jet-powered aircraft and balloons, and too low to permit orbital spacecraft. The mesosphere is mainly accessed by sounding rockets and rocket-powered aircraft.

    Stratosphere

    Main article: Stratosphere

    The stratosphere is the second-lowest layer of Earth’s atmosphere. It lies above the troposphere and is separated from it by the tropopause. This layer extends from the top of the troposphere at roughly 12 km (7.5 mi; 39,000 ft) above Earth’s surface to the stratopause at an altitude of about 50 to 55 km (31 to 34 mi; 164,000 to 180,000 ft).

    The atmospheric pressure at the top of the stratosphere is roughly 1/1000 the pressure at sea level. It contains the ozone layer, which is the part of Earth’s atmosphere that contains relatively high concentrations of that gas. The stratosphere defines a layer in which temperatures rise with increasing altitude. This rise in temperature is caused by the absorption of ultraviolet radiation (UV) from the Sun by the ozone layer, which restricts turbulence and mixing. Although the temperature may be −60 °C (−76 °F; 210 K) at the tropopause, the top of the stratosphere is much warmer, and may be near 0 °C.[24]

    The stratospheric temperature profile creates very stable atmospheric conditions, so the stratosphere lacks the weather-producing air turbulence that is so prevalent in the troposphere. Consequently, the stratosphere is almost completely free of clouds and other forms of weather. However, polar stratospheric or nacreous clouds are occasionally seen in the lower part of this layer of the atmosphere where the air is coldest. The stratosphere is the highest layer that can be accessed by jet-powered aircraft.

    Troposphere

    Main article: Troposphere

    A picture of Earth’s troposphere, with different cloud types at low and high altitudes casting shadows. Sunlight, filtered into a reddish hue by passing through much of the troposphere at sunset, is reflected off the ocean. The above-lying stratosphere can be seen at the horizon as a band of its characteristic glow of blue scattered sunlight.

    The troposphere is the lowest layer of Earth’s atmosphere. It extends from Earth’s surface to an average height of about 12 km (7.5 mi; 39,000 ft), although this altitude varies from about 9 km (5.6 mi; 30,000 ft) at the geographic poles to 17 km (11 mi; 56,000 ft) at the Equator,[17] with some variation due to weather. The troposphere is bounded above by the tropopause, a boundary marked in most places by a temperature inversion (i.e. a layer of relatively warm air above a colder one), and in others by a zone that is isothermal with height.[25][26]

    Although variations do occur, the temperature usually declines with increasing altitude in the troposphere because the troposphere is mostly heated through energy transfer from the surface. Thus, the lowest part of the troposphere (i.e. Earth’s surface) is typically the warmest section of the troposphere. This promotes vertical mixing (hence, the origin of its name in the Greek word τρόπος, tropos, meaning “turn”). The troposphere contains roughly 80% of the mass of Earth’s atmosphere.[27] The troposphere is denser than all its overlying layers because a larger atmospheric weight sits on top of the troposphere and causes it to be most severely compressed. Fifty percent of the total mass of the atmosphere is located in the lower 5.6 km (3.5 mi; 18,000 ft) of the troposphere.

    Nearly all atmospheric water vapor or moisture is found in the troposphere, so it is the layer where most of Earth’s weather takes place. It has basically all the weather-associated cloud genus types generated by active wind circulation, although very tall cumulonimbus thunder clouds can penetrate the tropopause from below and rise into the lower part of the stratosphere. Most conventional aviation activity takes place in the troposphere, and it is the only layer accessible by propeller-driven aircraft.

    Other layers

    Within the five principal layers above, which are largely determined by temperature, several secondary layers may be distinguished by other properties:

    • The ozone layer is contained within the stratosphere. In this layer ozone concentrations are about 2 to 8 parts per million, which is much higher than in the lower atmosphere but still very small compared to the main components of the atmosphere. It is mainly located in the lower portion of the stratosphere from about 15–35 km (9.3–21.7 mi; 49,000–115,000 ft), though the thickness varies seasonally and geographically. About 90% of the ozone in Earth’s atmosphere is contained in the stratosphere.
    • The ionosphere is a region of the atmosphere that is ionized by solar radiation. It is responsible for auroras. During daytime hours, it stretches from 50 to 1,000 km (31 to 621 mi; 160,000 to 3,280,000 ft) and includes the mesosphere, thermosphere, and parts of the exosphere. However, ionization in the mesosphere largely ceases during the night, so auroras are normally seen only in the thermosphere and lower exosphere. The ionosphere forms the inner edge of the magnetosphere. It has practical importance because it influences, for example, radio propagation on Earth.
    • The homosphere and heterosphere are defined by whether the atmospheric gases are well mixed. The surface-based homosphere includes the troposphere, stratosphere, mesosphere, and the lowest part of the thermosphere, where the chemical composition of the atmosphere does not depend on molecular weight because the gases are mixed by turbulence.[28] This relatively homogeneous layer ends at the turbopause found at about 100 km (62 mi; 330,000 ft), the very edge of space itself as accepted by the FAI, which places it about 20 km (12 mi; 66,000 ft) above the mesopause.

    Above this altitude lies the heterosphere, which includes the exosphere and most of the thermosphere. Here, the chemical composition varies with altitude. This is because the distance that particles can move without colliding with one another is large compared with the size of motions that cause mixing. This allows the gases to stratify by molecular weight, with the heavier ones, such as oxygen and nitrogen, present only near the bottom of the heterosphere. The upper part of the heterosphere is composed almost completely of hydrogen, the lightest element.[29]

    • The planetary boundary layer is the part of the troposphere that is closest to Earth’s surface and is directly affected by it, mainly through turbulent diffusion. During the day the planetary boundary layer usually is well-mixed, whereas at night it becomes stably stratified with weak or intermittent mixing. The depth of the planetary boundary layer ranges from as little as about 100 metres (330 ft) on clear, calm nights to 3,000 m (9,800 ft) or more during the afternoon in dry regions.

    The average temperature of the atmosphere at Earth’s surface is 14 °C (57 °F; 287 K)[30] or 15 °C (59 °F; 288 K),[31] depending on the reference.[32][33][34]

    Physical properties
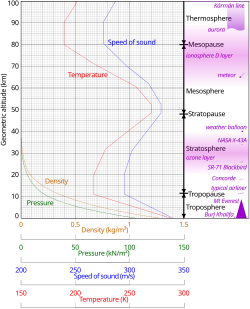
    Comparison of the 1962 US Standard Atmosphere graph of geometric altitude against air densitypressure, the speed of sound and temperature with approximate altitudes of various objects.[35]

    Pressure and thickness

    Main article: Atmospheric pressure

    The average atmospheric pressure at sea level is defined by the International Standard Atmosphere as 101325 pascals (760.00 Torr; 14.6959 psi; 760.00 mmHg). This is sometimes referred to as a unit of standard atmospheres (atm). Total atmospheric mass is 5.1480×10¹⁸ kg (1.13494×10¹⁹ lb),[36] about 2.5% less than would be inferred from the average sea-level pressure and Earth’s area of 51007.2 megahectares, this portion being displaced by Earth’s mountainous terrain. Atmospheric pressure is the total weight of the air above unit area at the point where the pressure is measured. Thus air pressure varies with location and weather.

    If the entire mass of the atmosphere had a uniform density equal to sea-level density (about 1.2 kg/m3) from sea level upwards, it would terminate abruptly at an altitude of 8.50 km (27,900 ft).

    Air pressure actually decreases exponentially with altitude, for altitudes up to around 70 km (43 mi; 230,000 ft), dropping by half every 5.6 km (18,000 ft), or by a factor of 1/e ≈ 0.368 every 7.64 km (25,100 ft), which is called the scale height. However, the atmosphere is more accurately modeled with a customized equation for each layer that takes gradients of temperature, molecular composition, solar radiation and gravity into account. At heights over 100 km, an atmosphere may no longer be well mixed. Then each chemical species has its own scale height.

    In summary, the mass of Earth’s atmosphere is distributed approximately as follows:[37]

    • 50% is below 5.6 km (18,000 ft),
    • 90% is below 16 km (52,000 ft),
    • 99.99997% is below 100 km (62 mi; 330,000 ft), the Kármán line. By international convention, this marks the beginning of space where human travelers are considered astronauts.

    By comparison, the summit of Mount Everest is at 8,848 m (29,029 ft); commercial airliners typically cruise between 10 and 13 km (33,000 and 43,000 ft), where the lower density and temperature of the air improve fuel economy; weather balloons reach 30.4 km (100,000 ft) and above; and the highest X-15 flight in 1963 reached 108.0 km (354,300 ft).

    Even above the Kármán line, significant atmospheric effects such as auroras still occur. Meteors begin to glow in this region, though the larger ones may not burn up until they penetrate more deeply. The various layers of Earth’s ionosphere, important to HF radio propagation, begin below 100 km and extend beyond 500 km. By comparison, the International Space Station and Space Shuttle typically orbit at 350–400 km, within the F-layer of the ionosphere, where they encounter enough atmospheric drag to require reboosts every few months, otherwise orbital decay will occur, resulting in a return to Earth. Depending on solar activity, satellites can experience noticeable atmospheric drag at altitudes as high as 700–800 km.

    Temperature

    Main article: Atmospheric temperature

    Temperature trends in two thick layers of the atmosphere as measured between January 1979 and December 2005 by microwave sounding units and advanced microwave sounding units on NOAA weather satellites. The instruments record microwaves emitted from oxygen molecules in the atmosphere. Source:[38]

    The division of the atmosphere into layers mostly by reference to temperature is discussed above. Temperature decreases with altitude starting at sea level, but variations in this trend begin above 11 km, where the temperature stabilizes over a large vertical distance through the rest of the troposphere. In the stratosphere, starting above about 20 km, the temperature increases with height, due to heating within the ozone layer caused by the capture of significant ultraviolet radiation from the Sun by the dioxygen and ozone gas in this region. Still another region of increasing temperature with altitude occurs at very high altitudes, in the aptly-named thermosphere above 90 km.

    Speed of sound

    Main article: Speed of sound

    Because in an ideal gas of constant composition the speed of sound depends only on temperature and not on pressure or density, the speed of sound in the atmosphere with altitude takes on the form of the complicated temperature profile (see illustration to the right), and does not mirror altitudinal changes in density or pressure.

    Density and mass

    Temperature and mass density against altitude from the NRLMSISE-00 standard atmosphere model (the eight dotted lines in each “decade” are at the eight cubes 8, 27, 64, …, 729)

    Main article: Density of air

    The density of air at sea level is about 1.2 kg/m3 (1.2 g/L, 0.0012 g/cm3). Density is not measured directly but is calculated from measurements of temperature, pressure and humidity using the equation of state for air (a form of the ideal gas law). Atmospheric density decreases as the altitude increases. This variation can be approximately modeled using the barometric formula. More sophisticated models are used to predict the orbital decay of satellites.

    The average mass of the atmosphere is about 5 quadrillion (5×10¹⁵tonnes or 1/1,200,000 the mass of Earth. According to the American National Center for Atmospheric Research, “The total mean mass of the atmosphere is 5.1480×10¹⁸ kg with an annual range due to water vapor of 1.2 or 1.5×10¹⁵ kg, depending on whether surface pressure or water vapor data are used; somewhat smaller than the previous estimate. The mean mass of water vapor is estimated as 1.27×10¹⁶ kg and the dry air mass as 5.1352 ±0.0003×10¹⁸ kg.”

    Tabulated properties

    Temperature
    [K]
    Density
    [kg/m3]
    Specific
    heat
    [J/(kg⋅°C)]
    Dynamic
    viscosity
    [kg/(m⋅s)]
    Kinematic
    viscosity
    [m2/s]
    Thermal
    conductivity
    [W/(m⋅°C)]
    Thermal
    diffusivity
    [m2/s]
    Prandtl
    number
    [1]
    Bulk
    modulus
    [K−1]
    1003.6011026.66.92×10−61.92×10−60.0009252.50×10−60.770.01
    1502.36751009.91.03×10−54.34×10−60.0137355.75×10−60.7530.006667
    2001.76841006.11.33×10−57.49×10−60.018091.02×10−50.7380.005
    2501.41281005.31.60×10−51.13×10−50.022271.57×10−50.7220.004
    3001.17741005.71.85×10−51.57×10−50.026242.22×10−50.7080.003333
    3500.99810092.08×10−52.08×10−50.030032.98×10−50.6970.002857
    4000.882610142.29×10−52.59×10−50.033653.76×10−50.6890.0025
    4500.78331020.72.48×10−53.17×10−50.037074.22×10−50.6830.002222
    5000.70481029.52.67×10−53.79×10−50.040385.56×10−50.680.002
    5500.64231039.22.85×10−54.43×10−50.04366.53×10−50.680.001818
    6000.58791055.13.02×10−55.13×10−50.046597.51×10−50.680.001667
    6500.5431063.53.18×10−55.85×10−50.049538.58×10−50.6820.001538
    7000.5031075.23.33×10−56.63×10−50.05239.67×10−50.6840.001429
    7500.47091085.63.48×10−57.39×10−50.055091.08×10−40.6860.001333
    8000.44051097.83.63×10−58.23×10−50.057791.20×10−40.6890.00125
    8500.41491109.53.77×10−59.08×10−50.060281.31×10−40.6920.001176
    9000.39251121.23.90×10−59.93×10−50.062791.43×10−40.6960.001111
    9500.37161132.14.02×10−51.08×10−40.065251.55×10−40.6990.001053
    10000.35241141.74.15×10−51.18×10−40.067531.68×10−40.7020.001
    11000.320411604.44×10−51.39×10−40.07321.97×10−40.7040.000909
    12000.294711794.69×10−51.59×10−40.07822.25×10−40.7070.000833
    13000.270711974.93×10−51.82×10−40.08372.58×10−40.7050.000769
    14000.251512145.17×10−52.06×10−40.08912.92×10−40.7050.000714
    15000.235512305.40×10−52.29×10−40.09463.26×10−40.7050.000667
    16000.221112485.63×10−52.55×10−40.13.61×10−40.7050.000625
    17000.208212675.85×10−52.81×10−40.1053.98×10−40.7050.000588
    18000.19712876.07×10−53.08×10−40.1114.38×10−40.7040.000556
    19000.185813096.29×10−53.39×10−40.1174.81×10−40.7040.000526
    20000.176213386.50×10−53.69×10−40.1245.26×10−40.7020.0005
    21000.168213726.72×10−54.00×10−40.1315.72×10−40.70.000476
    22000.160214196.93×10−54.33×10−40.1396.12×10−40.7070.000455
    23000.153814827.14×10−54.64×10−40.1496.54×10−40.710.000435
    24000.145815747.35×10−55.04×10−40.1617.02×10−40.7180.000417
    25000.139416887.57×10−55.44×10−40.1757.44×10−40.730.0004

    Optical properties

    See also: Sunlight

    Solar radiation (or sunlight) is the energy Earth receives from the Sun. Earth also emits radiation back into space, but at longer wavelengths that humans cannot see. Part of the incoming and emitted radiation is absorbed or reflected by the atmosphere.[41][42] In May 2017, glints of light, seen as twinkling from an orbiting satellite a million miles away, were found to be reflected light from ice crystals in the atmosphere.[43][44]

    Scattering

    Main article: Atmospheric scattering

    When light passes through Earth’s atmosphere, photons interact with it through scattering. If the light does not interact with the atmosphere, it is called direct radiation and is what you see if you were to look directly at the Sun. Indirect radiation is light that has been scattered in the atmosphere. For example, on an overcast day when you cannot see your shadow, there is no direct radiation reaching you, it has all been scattered. As another example, due to a phenomenon called Rayleigh scattering, shorter (blue) wavelengths scatter more easily than longer (red) wavelengths. This is why the sky looks blue; you are seeing scattered blue light. This is also why sunsets are red. Because the Sun is close to the horizon, the Sun’s rays pass through more atmosphere than normal before reaching your eye. Much of the blue light has been scattered out, leaving the red light in a sunset.

    Absorption

    Main article: Absorption (electromagnetic radiation)

    Rough plot of Earth’s atmospheric transmittance (or opacity) to various wavelengths of electromagnetic radiation, including visible light

    Different molecules absorb different wavelengths of radiation. For example, O2 and O3 absorb almost all radiation with wavelengths shorter than 300 nanometres. Water (H2O) absorbs at many wavelengths above 700 nm. When a molecule absorbs a photon, it increases the energy of the molecule. This heats the atmosphere, but the atmosphere also cools by emitting radiation, as discussed below.

    The combined absorption spectra of the gases in the atmosphere leave “windows” of low opacity, allowing the transmission of only certain bands of light. The optical window runs from around 300 nm (ultraviolet-C) up into the range humans can see, the visible spectrum (commonly called light), at roughly 400–700 nm and continues to the infrared to around 1100 nm. There are also infrared and radio windows that transmit some infrared and radio waves at longer wavelengths. For example, the radio window runs from about one centimetre to about eleven-metre waves.

    Emission

    Further information: Emission spectrum

    Emission is the opposite of absorption, it is when an object emits radiation. Objects tend to emit amounts and wavelengths of radiation depending on their “black body” emission curves, therefore hotter objects tend to emit more radiation, with shorter wavelengths. Colder objects emit less radiation, with longer wavelengths. For example, the Sun is approximately 6,000 K (5,730 °C; 10,340 °F), its radiation peaks near 500 nm, and is visible to the human eye. Earth is approximately 290 K (17 °C; 62 °F), so its radiation peaks near 10,000 nm, and is much too long to be visible to humans.

    Because of its temperature, the atmosphere emits infrared radiation. For example, on clear nights Earth’s surface cools down faster than on cloudy nights. This is because clouds (H2O) are strong absorbers and emitters of infrared radiation. This is also why it becomes colder at night at higher elevations.

    The greenhouse effect is directly related to this absorption and emission effect. Some gases in the atmosphere absorb and emit infrared radiation, but do not interact with sunlight in the visible spectrum. Common examples of these are CO2 and H2O.

    Refractive index

    Distortive effect of atmospheric refraction upon the shape of the sun at the horizon

    Main article: Atmospheric refraction

    See also: Scintillation (astronomy)

    The refractive index of air is close to, but just greater than, 1. Systematic variations in the refractive index can lead to the bending of light rays over long optical paths. One example is that, under some circumstances, observers on board ships can see other vessels just over the horizon because light is refracted in the same direction as the curvature of Earth’s surface.

    The refractive index of air depends on temperature,[45] giving rise to refraction effects when the temperature gradient is large. An example of such effects is the mirage.

    Circulation

    Main article: Atmospheric circulation

    An idealised view of three pairs of large circulation cells

    Atmospheric circulation is the large-scale movement of air through the troposphere, and the means (with ocean circulation) by which heat is distributed around Earth. The large-scale structure of the atmospheric circulation varies from year to year, but the basic structure remains fairly constant because it is determined by Earth’s rotation rate and the difference in solar radiation between the equator and poles.

    Evolution of Earth’s atmosphere

    See also: History of Earth and Paleoclimatology

    Earliest atmosphere

    The first atmosphere, during the Early Earth‘s Hadean eon, consisted of gases in the solar nebula, primarily hydrogen, and probably simple hydrides such as those now found in the gas giants (Jupiter and Saturn), notably water vapormethane and ammonia. During this earliest era, the Moon-forming collision and numerous impacts with large meteorites heated the atmosphere, driving off the most volatile gases. The collision with Theia, in particular, melted and ejected large portions of Earth’s mantle and crust and outgassed significant amounts of steam which eventually cooled and condensed to contribute to ocean water at the end of the Hadean.[46]: 10 

    Second atmosphere

    See also: Prebiotic atmosphere

    The increasing solidification of Earth’s crust at the end of the Hadean closed off most of the advective heat transfer to the surface, causing the atmosphere to cool, which condensed most of the water vapor out of the air precipitating into a superocean. Further outgassing from volcanism, supplemented by gases introduced by huge asteroids during the Late Heavy Bombardment, created the subsequent Archean atmosphere, which consisted largely of nitrogen plus carbon dioxidemethane and inert gases.[46] A major part of carbon dioxide emissions dissolved in water and reacted with metals such as calcium and magnesium during weathering of crustal rocks to form carbonates that were deposited as sediments. Water-related sediments have been found that date from as early as 3.8 billion years ago.[47]

    About 3.4 billion years ago, nitrogen formed the major component of the then-stable “second atmosphere”. The influence of the evolution of life has to be taken into account rather soon in the history of the atmosphere because hints of earliest life forms appeared as early as 3.5 billion years ago.[48] How Earth at that time maintained a climate warm enough for liquid water and life, if the early Sun put out 30% lower solar radiance than today, is a puzzle known as the “faint young Sun paradox“.

    The geological record however shows a continuous relatively warm surface during the complete early temperature record of Earth – with the exception of one cold glacial phase about 2.4 billion years ago. In the late Neoarchean, an oxygen-containing atmosphere began to develop, apparently due to a billion years of cyanobacterial photosynthesis (see Great Oxygenation Event), which have been found as stromatolite fossils from 2.7 billion years ago. The early basic carbon isotopy (isotope ratio proportions) strongly suggests conditions similar to the current, and that the fundamental features of the carbon cycle became established as early as 4 billion years ago.

    Ancient sediments in the Gabon dating from between about 2.15 and 2.08 billion years ago provide a record of Earth’s dynamic oxygenation evolution. These fluctuations in oxygenation were likely driven by the Lomagundi carbon isotope excursion.[49]

    Third atmosphere
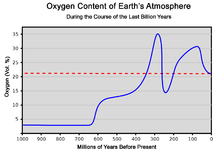
    Oxygen content of the atmosphere over the last billion years[50][51]

    Main article: Geological history of oxygen

    The constant re-arrangement of continents by plate tectonics influences the long-term evolution of the atmosphere by transferring carbon dioxide to and from large continental carbonate stores. Free oxygen did not exist in the atmosphere until about 2.4 billion years ago during the Great Oxygenation Event and its appearance is indicated by the end of banded iron formations (which signals the depletion of substrates that can react with oxygen to produce ferric deposits) during the early Proterozoic eon.

    Before this time, any oxygen produced by cyanobacterial photosynthesis would be readily removed by the oxidation of reducing substances on the Earth’s surface, notably ferrous ironsulfur and atmospheric methane. Free oxygen molecules did not start to accumulate in the atmosphere until the rate of production of oxygen began to exceed the availability of reductant materials that removed oxygen. This point signifies a shift from a reducing atmosphere to an oxidizing atmosphere. O2 showed major variations during the Proterozoic, including a billion-year period of euxinia, until reaching a steady state of more than 15% by the end of the Precambrian.[52] The rise of the more robust eukaryotic photoautotrophs (green and red algae) injected further oxygenation into the air, especially after the end of the Cryogenian global glaciation, which was followed by an evolutionary radiation event during the Ediacaran period known as the Avalon explosion, where complex metazoan life forms (including the earliest cnidariansplacozoans and bilaterians) first proliferated. The following time span from 539 million years ago to the present day is the Phanerozoic eon, during the earliest period of which, the Cambrian, more actively moving metazoan life began to appear and rapidly diversify in another radiation event called the Cambrian explosion, whose locomotive metabolism was fuelled by the rising oxygen level.

    The amount of oxygen in the atmosphere has fluctuated over the last 600 million years, reaching a peak of about 30% around 280 million years ago during the Carboniferous period, significantly higher than today’s 21%. Two main processes govern changes in the atmosphere: the evolution of plants and their increasing role in carbon fixation, and the consumption of oxygen by rapidly diversifying animal faunae and also by plants for photorespiration and their own metabolic needs at night. Breakdown of pyrite and volcanic eruptions release sulfur into the atmosphere, which reacts and hence reduces oxygen in the atmosphere. However, volcanic eruptions also release carbon dioxide, which can fuel oxygenic photosynthesis by terrestrial and aquatic plants. The cause of the variation of the amount of oxygen in the atmosphere is not precisely understood. Periods with more oxygen in the atmosphere were often associated with more rapid development of animals.

    Air pollution

    Animation shows the buildup of tropospheric CO2 in the Northern Hemisphere with a maximum around May. The maximum in the vegetation cycle follows in the late summer. Following the peak in vegetation, the drawdown of atmospheric CO2 due to photosynthesis is apparent, particularly over the boreal forests.

    Main article: Air pollution

    Air pollution is the introduction of airborne chemicalsparticulate matter or biological materials that cause harm or discomfort to organisms.[53] The population growthindustrialization and motorization of human societies have significantly increased the amount of airborne pollutants in the Earth’s atmosphere, causing noticeable problems such as smogsacid rains and pollution-related diseases. The depletion of stratospheric ozone layer, which shields the surface from harmful ionizing ultraviolet radiations, is also caused by air pollution, chiefly from chlorofluorocarbons and other ozone-depleting substances.

    Since 1750, human activity, especially after the Industrial Revolution, has increased the concentrations of various greenhouse gases, most importantly carbon dioxide, methane and nitrous oxideGreenhouse gas emissions, coupled with deforestation and destruction of wetlands via logging and land developments, have caused an observed rise in global temperatures, with the global average surface temperatures being 1.1 °C higher in the 2011–2020 decade than they were in 1850.[54] It has raised concerns of man-made climate change, which can have significant environmental impacts such as sea level riseocean acidificationglacial retreat (which threatens water security), increasing extreme weather events and wildfiresecological collapse and mass dying of wildlife.
  • Wind (Anemology)

    Wind is the natural movement of air or other gases relative to a planet’s surface. Winds occur on a range of scales, from thunderstorm flows lasting tens of minutes, to local breezes generated by heating of land surfaces and lasting a few hours, to global winds resulting from the difference in absorption of solar energy between the climate zones on Earth. The study of wind is called anemology.[1]

    The two main causes of large-scale atmospheric circulation are the differential heating between the equator and the poles, and the rotation of the planet (Coriolis effect). Within the tropics and subtropics, thermal low circulations over terrain and high plateaus can drive monsoon circulations. In coastal areas the sea breeze/land breeze cycle can define local winds; in areas that have variable terrain, mountain and valley breezes can prevail.

    Winds are commonly classified by their spatial scale, their speed and direction, the forces that cause them, the regions in which they occur, and their effect. Winds have various defining aspects such as velocity (wind speed), the density of the gases involved, and energy content or wind energy. In meteorology, winds are often referred to according to their strength, and the direction from which the wind is blowing. The convention for directions refer to where the wind comes from; therefore, a ‘western’ or ‘westerly’ wind blows from the west to the east, a ‘northern’ wind blows south, and so on. This is sometimes counter-intuitive.

    Short bursts of high speed wind are termed gusts. Strong winds of intermediate duration (around one minute) are termed squalls. Long-duration winds have various names associated with their average strength, such as breezegalestorm, and hurricane.

    In outer spacesolar wind is the movement of gases or charged particles from the Sun through space, while planetary wind is the outgassing of light chemical elements from a planet’s atmosphere into space. The strongest observed winds on a planet in the Solar System occur on Neptune and Saturn.

    In human civilization, the concept of wind has been explored in mythology, influenced the events of history, expanded the range of transport and warfare, and provided a power source for mechanical work, electricity, and recreation. Wind powers the voyages of sailing ships across Earth’s oceans. Hot air balloons use the wind to take short trips, and powered flight uses it to increase lift and reduce fuel consumption. Areas of wind shear caused by various weather phenomena can lead to dangerous situations for aircraft. When winds become strong, trees and human-made structures can be damaged or destroyed.

    Winds can shape landforms, via a variety of aeolian processes such as the formation of fertile soils, for example loess, and by erosion. Dust from large deserts can be moved great distances from its source region by the prevailing winds; winds that are accelerated by rough topography and associated with dust outbreaks have been assigned regional names in various parts of the world because of their significant effects on those regions. Wind also affects the spread of wildfires. Winds can disperse seeds from various plants, enabling the survival and dispersal of those plant species, as well as flying insect and bird populations. When combined with cold temperatures, the wind has a negative impact on livestock. Wind affects animals’ food stores, as well as their hunting and defensive strategies.

    Causes

    [edit]

    See also: Atmospheric pressure

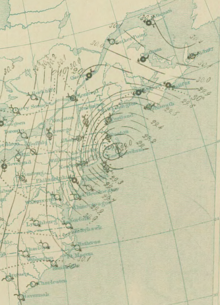
    Surface analysis of the Great Blizzard of 1888. Areas with greater isobaric packing indicate higher winds.

    Wind is caused by differences in atmospheric pressure, which are primarily due to temperature differences. When a difference in atmospheric pressure exists, air moves from the higher to the lower pressure area, resulting in winds of various speeds. On a rotating planet, air will also be deflected by the Coriolis effect, except exactly on the equator. Globally, the two major driving factors of large-scale wind patterns (the atmospheric circulation) are the differential heating between the equator and the poles (difference in absorption of solar energy leading to buoyancy forces) and the rotation of the planet. Outside the tropics and aloft from frictional effects of the surface, the large-scale winds tend to approach geostrophic balance. Near the Earth’s surface, friction causes the wind to be slower than it would be otherwise. Surface friction also causes winds to blow more inward into low-pressure areas.[2][3]

    Winds defined by an equilibrium of physical forces are used in the decomposition and analysis of wind profiles. They are useful for simplifying the atmospheric equations of motion and for making qualitative arguments about the horizontal and vertical distribution of horizontal winds. The geostrophic wind component is the result of the balance between Coriolis force and pressure gradient force. It flows parallel to isobars and approximates the flow above the atmospheric boundary layer in the midlatitudes.[4] The thermal wind is the difference in the geostrophic wind between two levels in the atmosphere. It exists only in an atmosphere with horizontal temperature gradients.[5] The ageostrophic wind component is the difference between actual and geostrophic wind, which is responsible for air “filling up” cyclones over time.[6] The gradient wind is similar to the geostrophic wind but also includes centrifugal force (or centripetal acceleration).[7]

    Measurement

    [edit]

    Cup-type anemometer on a remote meteorological station
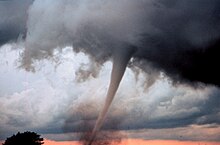
    An occluded mesocyclone tornado (Oklahoma, May 1999)

    Wind direction is usually expressed in terms of the direction from which it originates. For example, a northerly wind blows from the north to the south.[8] Weather vanes pivot to indicate the direction of the wind.[9] At airports, windsocks indicate wind direction, and can also be used to estimate wind speed by the angle of hang.[10] Wind speed is measured by anemometers, most commonly using rotating cups or propellers. When a high measurement frequency is needed (such as in research applications), wind can be measured by the propagation speed of ultrasound signals or by the effect of ventilation on the resistance of a heated wire.[11] Another type of anemometer uses pitot tubes that take advantage of the pressure differential between an inner tube and an outer tube that is exposed to the wind to determine the dynamic pressure, which is then used to compute the wind speed.[12]

    Sustained wind speeds are reported globally at a 10-meter (33 ft) height and are averaged over a 10‑minute time frame. The United States reports winds over a 1‑minute average for tropical cyclones,[13] and a 2‑minute average within weather observations.[14] India typically reports winds over a 3‑minute average.[15] Knowing the wind sampling average is important, as the value of a one-minute sustained wind is typically 14% greater than a ten-minute sustained wind.[16] A short burst of high speed wind is termed a wind gust; one technical definition of a wind gust is: the maxima that exceed the lowest wind speed measured during a ten-minute time interval by 10 knots (19 km/h; 12 mph) for periods of seconds. A squall is an increase of the wind speed above a certain threshold, which lasts for a minute or more.

    To determine winds aloft, radiosondes determine wind speed by GPSradio navigation, or radar tracking of the probe.[17] Alternatively, movement of the parent weather balloon position can be tracked from the ground visually using theodolites.[18] Remote sensing techniques for wind include SODARDoppler lidars and radars, which can measure the Doppler shift of electromagnetic radiation scattered or reflected off suspended aerosols or molecules, and radiometers and radars can be used to measure the surface roughness of the ocean from space or airplanes. Ocean roughness can be used to estimate wind velocity close to the sea surface over oceans. Geostationary satellite imagery can be used to estimate the winds at cloud top based upon how far clouds move from one image to the next. Wind engineering describes the study of the effects of the wind on the built environment, including buildings, bridges and other artificial objects.

    Models

    [edit]

    Models can provide spatial and temporal information about airflow. Spatial information can be obtained through the interpolation of data from various measurement stations, allowing for horizontal data calculation. Alternatively, profiles, such as the logarithmic wind profile, can be utilized to derive vertical information.

    Temporal information is typically computed by solving the Navier-Stokes equations within numerical weather prediction models, generating global data for General Circulation Models or specific regional data. The calculation of wind fields is influenced by factors such as radiation differentials, Earth’s rotation, and friction, among others.[19] Solving the Navier-Stokes equations is a time-consuming numerical process, but machine learning techniques can help expedite computation time.[20]

    Numerical weather prediction models have significantly advanced our understanding of atmospheric dynamics and have become indispensable tools in weather forecasting and climate research. By leveraging both spatial and temporal data, these models enable scientists to analyze and predict global and regional wind patterns, contributing to our comprehension of the Earth’s complex atmospheric system.

    Wind force scale

    [edit]

    See also: Tropical cyclone scales and Surface weather analysis

    Historically, the Beaufort wind force scale, created by Francis Beaufort, provides an empirical description of wind speed based on observed sea conditions. Originally it was a 13-level scale (0–12), but during the 1940s, the scale was expanded to 18 levels (0–17).[21] There are general terms that differentiate winds of different average speeds such as a breeze, a gale, a storm, or a hurricane. Within the Beaufort scale, gale-force winds lie between 28 knots (52 km/h) and 55 knots (102 km/h) with preceding adjectives such as moderate, fresh, strong, and whole used to differentiate the wind’s strength within the gale category.[22] A storm has winds of 56 knots (104 km/h) to 63 knots (117 km/h).[23] The terminology for tropical cyclones differs from one region to another globally. Most ocean basins use the average wind speed to determine the tropical cyclone’s category. Below is a summary of the classifications used by Regional Specialized Meteorological Centers worldwide:

    hideGeneral wind classificationsTropical cyclone classifications (all winds are 10-minute averages)
    Beaufort scale[21]10-minute sustained windsGeneral term[24]N Indian Ocean
    IMD
    SW Indian Ocean
    MF
    Australian region
    South Pacific
    BoMBMKGFMSMSNZ
    NW Pacific
    JMA
    NW Pacific
    JTWC
    NE Pacific &
    N Atlantic
    NHC & CPHC
    (knots)(km/h)
    0<1<2CalmLow Pressure AreaTropical disturbanceTropical low
    Tropical Depression
    Tropical depressionTropical depressionTropical depression
    11–32–6Light air
    24–67–11Light breeze
    37–1013–19Gentle breeze
    411–1620–30Moderate breeze
    517–2131–39Fresh breezeDepression
    622–2741–50Strong breeze
    728–2952–54Moderate galeDeep depressionTropical depression
    30–3356–61
    834–4063–74Fresh galeCyclonic stormModerate tropical stormTropical cyclone (1)Tropical stormTropical stormTropical storm
    941–4776–87Strong gale
    1048–5589–102Whole galeSevere cyclonic stormSevere tropical stormTropical cyclone (2)Severe tropical storm
    1156–63104–117Storm
    1264–72119–133HurricaneVery severe cyclonic stormTropical cycloneSevere tropical cyclone (3)TyphoonTyphoonHurricane (1)
    1373–85135–157Hurricane (2)
    1486–89159–165Severe tropical cyclone (4)Major hurricane (3)
    1590–99167–183Intense tropical cyclone
    16100–106185–196Major hurricane (4)
    17107–114198–211Severe tropical cyclone (5)
    115–119213–220Very intense tropical cycloneSuper typhoon
    >120>222Super cyclonic stormMajor hurricane (5)

    Enhanced Fujita scale

    [edit]

    The Enhanced Fujita Scale (EF Scale) rates the strength of tornadoes by using damage to estimate wind speed. It has six levels, from visible damage to complete destruction. It is used in the United States and in some other countries, including Canada and France, with small modifications.[25]

    Station model

    [edit]

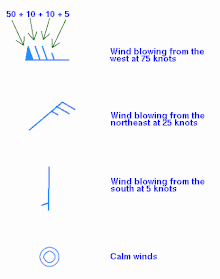
    Wind plotting within a station model

    The station model plotted on surface weather maps uses a wind barb to show both wind direction and speed. The wind barb shows the speed using “flags” on the end.

    • Each half of a flag depicts 5 knots (9.3 km/h; 5.8 mph) of wind.
    • Each full flag depicts 10 knots (19 km/h; 12 mph) of wind.
    • Each pennant (filled triangle) depicts 50 knots (93 km/h; 58 mph) of wind.[26]

    Winds are depicted as blowing from the direction the barb is facing. Therefore, a northeast wind will be depicted with a line extending from the cloud circle to the northeast, with flags indicating wind speed on the northeast end of this line.[27] Once plotted on a map, an analysis of isotachs (lines of equal wind speeds) can be accomplished. Isotachs are particularly useful in diagnosing the location of the jet stream on upper-level constant pressure charts, and are usually located at or above the 300 hPa level.[28]

    Global climatology

    [edit]

    Main article: Prevailing winds

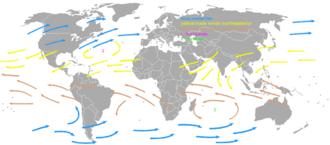
    The westerlies and trade winds
    Winds are part of Earth’s atmospheric circulation

    Easterly winds, on average, dominate the flow pattern across the poles, westerly winds blow across the mid-latitudes of the Earth, polewards of the subtropical ridge, while easterlies again dominate the tropics.

    Directly under the subtropical ridge are the doldrums, or horse latitudes, where winds are lighter. Many of the Earth’s deserts lie near the average latitude of the subtropical ridge, where descent reduces the relative humidity of the air mass.[29] The strongest winds are in the mid-latitudes where cold polar air meets warm air from the tropics.

    Tropics

    [edit]

    See also: Trade wind and Monsoon

    The trade winds (also called trades) are the prevailing pattern of easterly surface winds found in the tropics towards the Earth’s equator.[30] The trade winds blow predominantly from the northeast in the Northern Hemisphere and from the southeast in the Southern Hemisphere.[31] The trade winds act as the steering flow for tropical cyclones that form over the world’s oceans.[32] Trade winds also steer African dust westward across the Atlantic Ocean into the Caribbean, as well as portions of southeast North America.[33]

    monsoon is a seasonal prevailing wind that lasts for several months within tropical regions. The term was first used in English in India, Bangladesh, Pakistan, and neighboring countries to refer to the big seasonal winds blowing from the Indian Ocean and Arabian Sea in the southwest bringing heavy rainfall to the area.[34] Its poleward progression is accelerated by the development of a heat low over the Asian, African, and North American continents during May through July, and over Australia in December.[35][36][37]

    Westerlies and their impact

    [edit]

    Benjamin Franklin‘s map of the Gulf Stream

    Main article: Westerlies

    The Westerlies or the Prevailing Westerlies are the prevailing winds in the middle latitudes between 35 and 65 degrees latitude. These prevailing winds blow from the west to the east,[38][39] and steer extratropical cyclones in this general manner. The winds are predominantly from the southwest in the Northern Hemisphere and from the northwest in the Southern Hemisphere.[31] They are strongest in the winter when the pressure is lower over the poles, and weakest during the summer and when pressures are higher over the poles.[40]

    Together with the trade winds, the westerlies enabled a round-trip trade route for sailing ships crossing the Atlantic and Pacific Oceans, as the westerlies lead to the development of strong ocean currents on the western sides of oceans in both hemispheres through the process of western intensification.[41] These western ocean currents transport warm, sub-tropical water polewards toward the polar regions. The westerlies can be particularly strong, especially in the southern hemisphere, where there is less land in the middle latitudes to cause the flow pattern to amplify, which slows the winds down. The strongest westerly winds in the middle latitudes are within a band known as the Roaring Forties, between 40 and 50 degrees latitude south of the equator.[42] The Westerlies play an important role in carrying the warm, equatorial waters and winds to the western coasts of continents,[43][44] especially in the southern hemisphere because of its vast oceanic expanse.

    Polar easterlies

    [edit]

    Main article: Polar easterlies

    The polar easterlies, also known as Polar Hadley cells, are dry, cold prevailing winds that blow from the high-pressure areas of the polar highs at the north and South Poles towards the low-pressure areas within the Westerlies at high latitudes. Unlike the Westerlies, these prevailing winds blow from the east to the west, and are often weak and irregular.[45] Because of the low sun angle, cold air builds up and subsides at the pole creating surface high-pressure areas, forcing an equatorward outflow of air;[46] that outflow is deflected westward by the Coriolis effect.

    Local considerations

    [edit]

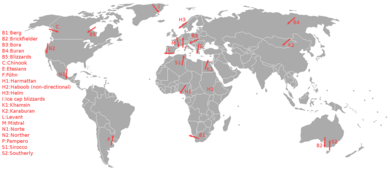
    Local winds around the world. These winds are formed through the heating of land (from mountains or flat terrain)

    Sea and land breezes

    [edit]

    Main article: Sea breeze

    A: Sea breeze (occurs at daytime), B: Land breeze (occurs at nighttime)

    In coastal regions, sea breezes and land breezes can be important factors in a location’s prevailing winds. The sea is warmed by the sun more slowly because of water’s greater specific heat compared to land. As the temperature of the surface of the land rises, the land heats the air above it by conduction. The warm air is less dense than the surrounding environment and so it rises.[47] The cooler air above the sea, now with higher sea level pressure, flows inland into the lower pressure, creating a cooler breeze near the coast. A background along-shore wind either strengthens or weakens the sea breeze, depending on its orientation with respect to the Coriolis force.[48]

    At night, the land cools off more quickly than the ocean because of differences in their specific heat values. This temperature change causes the daytime sea breeze to dissipate. When the temperature onshore cools below the temperature offshore, the pressure over the water will be lower than that of the land, establishing a land breeze, as long as an onshore wind is not strong enough to oppose it.[49]

    Near mountains

    [edit]

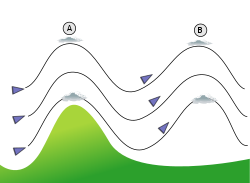
    Mountain wave schematic. The wind flows towards a mountain and produces a first oscillation (A). A second wave occurs further away and higher. The lenticular clouds form at the peak of the waves (B).

    Over elevated surfaces, heating of the ground exceeds the heating of the surrounding air at the same altitude above sea level, creating an associated thermal low over the terrain and enhancing any thermal lows that would have otherwise existed,[50][51] and changing the wind circulation of the region. In areas where there is rugged topography that significantly interrupts the environmental wind flow, the wind circulation between mountains and valleys is the most important contributor to the prevailing winds. Hills and valleys substantially distort the airflow by increasing friction between the atmosphere and landmass by acting as a physical block to the flow, deflecting the wind parallel to the range just upstream of the topography, which is known as a barrier jet. This barrier jet can increase the low-level wind by 45%.[52] Wind direction also changes because of the contour of the land.[53]

    If there is a pass in the mountain range, winds will rush through the pass with considerable speed because of the Bernoulli principle that describes an inverse relationship between speed and pressure. The airflow can remain turbulent and erratic for some distance downwind into the flatter countryside. These conditions are dangerous to ascending and descending airplanes.[53] Cool winds accelerating through mountain gaps have been given regional names. In Central America, examples include the Papagayo wind, the Panama wind, and the Tehuano wind. In Europe, similar winds are known as the BoraTramontane, and Mistral. When these winds blow over open waters, they increase mixing of the upper layers of the ocean that elevates cool, nutrient rich waters to the surface, which leads to increased marine life.[54]

    In mountainous areas, local distortion of the airflow becomes severe. Jagged terrain combines to produce unpredictable flow patterns and turbulence, such as rotors, which can be topped by lenticular clouds. Strong updrafts, downdrafts, and eddies develop as the air flows over hills and down valleys. Orographic precipitation occurs on the windward side of mountains and is caused by the rising air motion of a large-scale flow of moist air across the mountain ridge, also known as upslope flow, resulting in adiabatic cooling and condensation. In mountainous parts of the world subjected to relatively consistent winds (for example, the trade winds), a more moist climate usually prevails on the windward side of a mountain than on the leeward or downwind side. Moisture is removed by orographic lift, leaving drier air on the descending and generally warming, leeward side where a rain shadow is observed.[55]

    Winds that flow over mountains down into lower elevations are known as downslope winds. These winds are warm and dry. In Europe downwind of the Alps, they are known as foehn. In Poland, an example is the halny wiatr. In Argentina, the local name for down sloped winds is zonda. In Java, the local name for such winds is koembang. In New Zealand, they are known as the Nor’west arch, and are accompanied by the cloud formation they are named after that has inspired artwork over the years.[56] In the Great Plains of the United States, these winds are known as a chinook. Downslope winds also occur in the foothills of the Appalachian mountains of the United States,[57] and they can be as strong as other downslope winds[58] and unusual compared to other foehn winds in that the relative humidity typically changes little due to the increased moisture in the source air mass.[59] In California, downslope winds are funneled through mountain passes, which intensify their effect, and examples include the Santa Ana and sundowner winds. Wind speeds during downslope wind effect can exceed 160 kilometers per hour (99 mph).[60]

    Shear

    [edit]

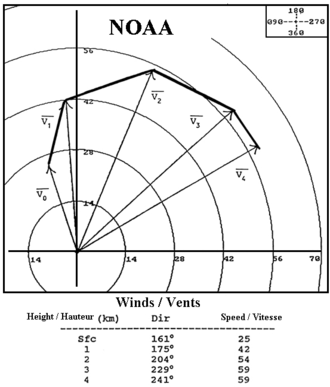
    Hodograph plot of wind vectors at various heights in the troposphere, which is used to diagnose vertical wind shear

    Main article: Wind shear

    Wind shear, sometimes referred to as wind gradient, is a difference in wind speed and direction over a relatively short distance in the Earth’s atmosphere.[61] Wind shear can be broken down into vertical and horizontal components, with horizontal wind shear seen across weather fronts and near the coast,[62] and vertical shear typically near the surface,[63] though also at higher levels in the atmosphere near upper level jets and frontal zones aloft.[64]

    Wind shear itself is a microscale meteorological phenomenon occurring over a very small distance, but it can be associated with mesoscale or synoptic scale weather features such as squall lines and cold fronts. It is commonly observed near microbursts and downbursts caused by thunderstorms,[65] weather fronts, areas of locally higher low level winds referred to as low level jets, near mountains,[66] radiation inversions that occur because of clear skies and calm winds, buildings,[67] wind turbines,[68] and sailboats.[69] Wind shear has a significant effect on the control of aircraft during take-off and landing,[70] and was a significant cause of aircraft accidents involving large loss of life within the United States.[65]

    Sound movement through the atmosphere is affected by wind shear, which can bend the wave front, causing sounds to be heard where they normally would not, or vice versa.[71] Strong vertical wind shear within the troposphere also inhibits tropical cyclone development,[72] but helps to organize individual thunderstorms into living longer life cycles that can then produce severe weather.[73] The thermal wind concept explains how differences in wind speed with height are dependent on horizontal temperature differences, and explains the existence of the jet stream.[74]

    In civilization

    [edit]

    Religion

    [edit]

    As a natural force, the wind was often personified as one or more wind gods or as an expression of the supernatural in many cultures. Vayu is the Vedic and Hindu God of Wind.[75][76] The Greek wind gods include BoreasNotusEurus, and Zephyrus.[76] Aeolus, in varying interpretations the ruler or keeper of the four winds, has also been described as Astraeus, the god of dusk who fathered the four winds with Eos, goddess of dawn. The ancient Greeks also observed the seasonal change of the winds, as evidenced by the Tower of the Winds in Athens.[76] Venti are the Roman gods of the winds.[77] Fūjin is the Japanese wind god and is one of the eldest Shinto gods. According to legend, he was present at the creation of the world and first let the winds out of his bag to clear the world of mist.[78] In Norse mythologyNjörðr is the god of the wind.[76] There are also four dvärgar (Norse dwarves), named Norðri, Suðri, Austri and Vestri, and probably the four stags of Yggdrasil, personify the four winds, and parallel the four Greek wind gods.[79] Stribog is the name of the Slavic god of winds, sky and air. He is said to be the ancestor (grandfather) of the winds of the eight directions.[76]

    History

    [edit]

    Kamikaze is a Japanese word, usually translated as divine wind, believed to be a gift from the gods. The term is first known to have been used as the name of a pair or series of typhoons that are said to have saved Japan from two Mongol fleets under Kublai Khan that attacked Japan in 1274 and again in 1281.[80] Protestant Wind is a name for the storm that deterred the Spanish Armada from an invasion of England in 1588 where the wind played a pivotal role,[81] or the favorable winds that enabled William of Orange to invade England in 1688.[82] During Napoleon‘s Egyptian Campaign, the French soldiers had a hard time with the khamsin wind: when the storm appeared “as a blood-stint in the distant sky”, the Ottomans went to take cover, while the French “did not react until it was too late, then choked and fainted in the blinding, suffocating walls of dust”.[83] During the North African Campaign of the World War II, “allied and German troops were several times forced to halt in mid-battle because of sandstorms caused by khamsin… Grains of sand whirled by the wind blinded the soldiers and created electrical disturbances that rendered compasses useless.”[84]

    Transportation

    [edit]

    RAF Exeter airfield on 20 May 1944, showing the layout of the runways that allow aircraft to take off and land into the wind

    There are many different forms of sailing ships, but they all have certain basic things in common. Except for rotor ships using the Magnus effect, every sailing ship has a hullrigging and at least one mast to hold up the sails that use the wind to power the ship.[85] Ocean journeys by sailing ship can take many months,[86] and a common hazard is becoming becalmed because of lack of wind,[87] or being blown off course by severe storms or winds that do not allow progress in the desired direction.[88] A severe storm could lead to shipwreck, and the loss of all hands.[89] Sailing ships can only carry a certain quantity of supplies in their hold, so they have to plan long voyages carefully to include appropriate provisions, including fresh water.[90]

    For aerodynamic aircraft which operate relative to the air, winds affect groundspeed,[91] and in the case of lighter-than-air vehicles, wind may play a significant or solitary role in their movement and ground track.[92] The velocity of surface wind is generally the primary factor governing the direction of flight operations at an airport, and airfield runways are aligned to account for the common wind direction(s) of the local area. While taking off with a tailwind may be necessary under certain circumstances, a headwind is generally desirable. A tailwind increases takeoff distance required and decreases the climb gradient.[93]

    Power source

    [edit]

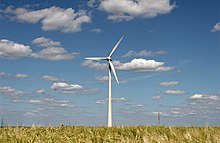
    This wind turbine generates electricity from wind power.

    See also: Wind power and Wind atlas

    The ancient Sinhalese of Anuradhapura and in other cities around Sri Lanka used the monsoon winds to power furnaces as early as 300 BCE. The furnaces were constructed on the path of the monsoon winds to bring the temperatures inside up to 1,200 °C (2,190 °F).[94] A rudimentary windmill was used to power an organ in the first century CE.[95] Windmills were later built in SistanAfghanistan, from the 7th century CE. These were vertical-axle windmills,[96] with sails covered in reed matting or cloth material. These windmills were used to grind corn and draw up water, and were used in the gristmilling and sugarcane industries.[97] Horizontal-axle windmills were later used extensively in Northwestern Europe to grind flour beginning in the 1180s, and many Dutch windmills still exist.

    Wind power is now one of the main sources of renewable energy, and its use is growing rapidly, driven by innovation and falling prices.[98] Most of the installed capacity in wind power is onshore, but offshore wind power offers a large potential as wind speeds are typically higher and more constant away from the coast.[99] Wind energy the kinetic energy of the air, is proportional to the third power of wind velocity. Betz’s law described the theoretical upper limit of what fraction of this energy wind turbines can extract, which is about 59%.[100]

    Recreation

    [edit]

    Otto Lilienthal in flight

    Wind figures prominently in several popular sports, including recreational hang glidinghot air ballooningkite flying, snowkitingkite landboardingkite surfingparaglidingsailing, and windsurfing. In gliding, wind gradients just above the surface affect the takeoff and landing phases of flight of a glider. Wind gradient can have a noticeable effect on ground launches, also known as winch launches or wire launches. If the wind gradient is significant or sudden, or both, and the pilot maintains the same pitch attitude, the indicated airspeed will increase, possibly exceeding the maximum ground launch tow speed. The pilot must adjust the airspeed to deal with the effect of the gradient.[101] When landing, wind shear is also a hazard, particularly when the winds are strong. As the glider descends through the wind gradient on final approach to landing, airspeed decreases while sink rate increases, and there is insufficient time to accelerate prior to ground contact. The pilot must anticipate the wind gradient and use a higher approach speed to compensate for it.[102]

    In the natural world

    [edit]

    See also: Aeolian processes

    In arid climates, the main source of erosion is wind.[103] The general wind circulation moves small particulates such as dust across wide oceans thousands of kilometers downwind of their point of origin,[104] which is known as deflation. Westerly winds in the mid-latitudes of the planet drive the movement of ocean currents from west to east across the world’s oceans. Wind has a very important role in aiding plants and other immobile organisms in dispersal of seeds, spores, pollen, etc. Although wind is not the primary form of seed dispersal in plants, it provides dispersal for a large percentage of the biomass of land plants.

    Erosion

    [edit]

    A rock formation in the AltiplanoBolivia, sculpted by wind erosion

    Erosion can be the result of material movement by the wind. There are two main effects. First, wind causes small particles to be lifted and therefore moved to another region. This is called deflation. Second, these suspended particles may impact on solid objects causing erosion by abrasion (ecological succession). Wind erosion generally occurs in areas with little or no vegetation, often in areas where there is insufficient rainfall to support vegetation. An example is the formation of sand dunes, on a beach or in a desert.[105] Loess is a homogeneous, typically nonstratified, porous, friable, slightly coherent, often calcareous, fine-grained, silty, pale yellow or buff, windblown (Aeolian) sediment.[106] It generally occurs as a widespread blanket deposit that covers areas of hundreds of square kilometers and tens of meters thick. Loess often stands in either steep or vertical faces.[107] Loess tends to develop into highly rich soils. Under appropriate climatic conditions, areas with loess are among the most agriculturally productive in the world.[108] Loess deposits are geologically unstable by nature, and will erode very readily. Therefore, windbreaks (such as big trees and bushes) are often planted by farmers to reduce the wind erosion of loess.[103]

    Desert dust migration

    [edit]

    During mid-summer (July in the northern hemisphere), the westward-moving trade winds south of the northward-moving subtropical ridge expand northwestward from the Caribbean into southeastern North America. When dust from the Sahara moving around the southern periphery of the ridge within the belt of trade winds moves over land, rainfall is suppressed and the sky changes from a blue to a white appearance, which leads to an increase in red sunsets. Its presence negatively impacts air quality by adding to the count of airborne particulates.[109] Over 50% of the African dust that reaches the United States affects Florida.[110] Since 1970, dust outbreaks have worsened because of periods of drought in Africa. There is a large variability in the dust transport to the Caribbean and Florida from year to year.[111] Dust events have been linked to a decline in the health of coral reefs across the Caribbean and Florida, primarily since the 1970s.[112] Similar dust plumes originate in the Gobi Desert, which combined with pollutants, spread large distances downwind, or eastward, into North America.[104]

    There are local names for winds associated with sand and dust storms. The Calima carries dust on southeast winds into the Canary islands.[113] The Harmattan carries dust during the winter into the Gulf of Guinea.[114] The Sirocco brings dust from north Africa into southern Europe because of the movement of extratropical cyclones through the Mediterranean.[115] Spring storm systems moving across the eastern Mediterranean Sea cause dust to carry across Egypt and the Arabian Peninsula, which are locally known as Khamsin.[116] The Shamal is caused by cold fronts lifting dust into the atmosphere for days at a time across the Persian Gulf states.[117]

    Effect on plants

    [edit]

    Tumbleweed blown against a fence
    In the montane forest of Olympic National Parkwindthrow opens the canopy and increases light intensity on the understory.

    See also: Seed dispersal

    Wind dispersal of seeds, or anemochory, is one of the more primitive means of dispersal. Wind dispersal can take on one of two primary forms: seeds can float on the breeze or alternatively, they can flutter to the ground.[118] The classic examples of these dispersal mechanisms include dandelions (Taraxacum spp., Asteraceae), which have a feathery pappus attached to their seeds and can be dispersed long distances, and maples (Acer (genus) spp., Sapindaceae), which have winged seeds and flutter to the ground. An important constraint on wind dispersal is the need for abundant seed production to maximize the likelihood of a seed landing in a site suitable for germination. There are also strong evolutionary constraints on this dispersal mechanism. For instance, species in the Asteraceae on islands tended to have reduced dispersal capabilities (i.e., larger seed mass and smaller pappus) relative to the same species on the mainland.[119] Reliance upon wind dispersal is common among many weedy or ruderal species. Unusual mechanisms of wind dispersal include tumbleweeds. A related process to anemochory is anemophily, which is the process where pollen is distributed by wind. Large families of plants are pollinated in this manner, which is favored when individuals of the dominant plant species are spaced closely together.[120]

    Wind also limits tree growth. On coasts and isolated mountains, the tree line is often much lower than in corresponding altitudes inland and in larger, more complex mountain systems, because strong winds reduce tree growth. High winds scour away thin soils through erosion,[121] as well as damage limbs and twigs. When high winds knock down or uproot trees, the process is known as windthrow. This is most likely on windward slopes of mountains, with severe cases generally occurring to tree stands that are 75 years or older.[122] Plant varieties near the coast, such as the Sitka spruce and sea grape,[123] are pruned back by wind and salt spray near the coastline.[124]

    Wind can also cause plants damage through sand abrasion. Strong winds will pick up loose sand and topsoil and hurl it through the air at speeds ranging from 25 miles per hour (40 km/h) to 40 miles per hour (64 km/h). Such windblown sand causes extensive damage to plant seedlings because it ruptures plant cells, making them vulnerable to evaporation and drought. Using a mechanical sandblaster in a laboratory setting, scientists affiliated with the Agricultural Research Service studied the effects of windblown sand abrasion on cotton seedlings. The study showed that the seedlings responded to the damage created by the windblown sand abrasion by shifting energy from stem and root growth to the growth and repair of the damaged stems.[125] After a period of four weeks, the growth of the seedling once again became uniform throughout the plant, as it was before the windblown sand abrasion occurred.[126]

    Besides plant gametes (seeds) wind also helps plants’ enemies: Spores and other propagules of plant pathogens are even lighter and able to travel long distances.[127] A few plant diseases are known to have been known to travel over marginal seas[128] and even entire oceans.[129] Humans are unable to prevent or even slow down wind dispersal of plant pathogens, requiring prediction and amelioration instead.[130]

    Effect on animals

    [edit]

    Cattle and sheep are prone to wind chill caused by a combination of wind and cold temperatures, when winds exceed 40 kilometers per hour (25 mph), rendering their hair and wool coverings ineffective.[131] Although penguins use both a layer of fat and feathers to help guard against coldness in both water and air, their flippers and feet are less immune to the cold. In the coldest climates such as Antarcticaemperor penguins use huddling behavior to survive the wind and cold, continuously alternating the members on the outside of the assembled group, which reduces heat loss by 50%.[132] Flying insects, a subset of arthropods, are swept along by the prevailing winds,[133] while birds follow their own course taking advantage of wind conditions, in order to either fly or glide.[134] As such, fine line patterns within weather radar imagery, associated with converging winds, are dominated by insect returns.[135] Bird migration, which tends to occur overnight within the lowest 7,000 feet (2,100 m) of the Earth’s atmosphere, contaminates wind profiles gathered by weather radar, particularly the WSR-88D, by increasing the environmental wind returns by 15 knots (28 km/h) to 30 knots (56 km/h).[136]

    Pikas use a wall of pebbles to store dry plants and grasses for the winter in order to protect the food from being blown away.[137] Cockroaches use slight winds that precede the attacks of potential predators, such as toads, to survive their encounters. Their cerci are very sensitive to the wind, and help them survive half of their attacks.[138] Elk have a keen sense of smell that can detect potential upwind predators at a distance of 0.5 miles (800 m).[139] Increases in wind above 15 kilometers per hour (9.3 mph) signals glaucous gulls to increase their foraging and aerial attacks on thick-billed murres.[140]

    [edit]

    See also: Severe weather

    Damage from Hurricane Andrew

    High winds are known to cause damage, depending upon the magnitude of their velocity and pressure differential. Wind pressures are positive on the windward side of a structure and negative on the leeward side. Infrequent wind gusts can cause poorly designed suspension bridges to sway. When wind gusts are at a similar frequency to the swaying of the bridge, the bridge can be destroyed more easily, such as what occurred with the Tacoma Narrows Bridge in 1940.[141] Wind speeds as low as 23 knots (43 km/h) can lead to power outages due to tree branches disrupting the flow of energy through power lines.[142] While no species of tree is guaranteed to stand up to hurricane-force winds, those with shallow roots are more prone to uproot, and brittle trees such as eucalyptus, sea hibiscus, and avocado are more prone to damage.[143] Hurricane-force winds cause substantial damage to mobile homes, and begin to structurally damage homes with foundations. Winds of this strength due to downsloped winds off terrain have been known to shatter windows and sandblast paint from cars.[60] Once winds exceed 135 knots (250 km/h), homes completely collapse, and significant damage is done to larger buildings. Total destruction to artificial structures occurs when winds reach 175 knots (324 km/h). The Saffir–Simpson scale and Enhanced Fujita scale were designed to help estimate wind speed from the damage caused by high winds related to tropical cyclones and tornadoes, and vice versa.[144][145]

    Australia’s Barrow Island holds the record for the strongest wind gust, reaching 408 km/h (253 mph) during tropical Cyclone Olivia on 10 April 1996, surpassing the previous record of 372 km/h (231 mph) set on Mount Washington (New Hampshire) on the afternoon of 12 April 1934.[146]

    Wildfire intensity increases during daytime hours. For example, burn rates of smoldering logs are up to five times greater during the day because of lower humidity, increased temperatures, and increased wind speeds.[147] Sunlight warms the ground during the day and causes air currents to travel uphill, and downhill during the night as the land cools. Wildfires are fanned by these winds and often follow the air currents over hills and through valleys.[148] United States wildfire operations revolve around a 24-hour fire day that begins at 10:00 a.m. because of the predictable increase in intensity resulting from the daytime warmth.[149]

    In outer space

    [edit]

    Main article: Stellar wind

    The solar wind is quite different from a terrestrial wind, in that its origin is the Sun, and it is composed of charged particles that have escaped the Sun’s atmosphere. Similar to the solar wind, the planetary wind is composed of light gases that escape planetary atmospheres. Over long periods of time, the planetary wind can radically change the composition of planetary atmospheres.

    The fastest wind ever recorded came from the accretion disc of the IGR J17091-3624 black hole. Its speed is 20,000,000 miles per hour (32,000,000 km/h), which is 3% of the speed of light.[150]

    Planetary wind

    [edit]

    Main article: Atmospheric escape

    A possible future for Earth due to the planetary wind: Venus

    The hydrodynamic wind within the upper portion of a planet’s atmosphere allows light chemical elements such as hydrogen to move up to the exobase, the lower limit of the exosphere, where the gases can then reach escape velocity, entering outer space without impacting other particles of gas. This type of gas loss from a planet into space is known as planetary wind.[151] Such a process over geologic time causes water-rich planets such as the Earth to evolve into planets like Venus.[152] Additionally, planets with hotter lower atmospheres could accelerate the loss rate of hydrogen.[153]

    Solar wind

    [edit]

    Main article: Solar wind

    Rather than air, the solar wind is a stream of charged particles—a plasma—ejected from the upper atmosphere of the Sun at a rate of 400 kilometers per second (890,000 mph).[154] It consists mostly of electrons and protons with energies of about 1 keV. The stream of particles varies in temperature and speed with the passage of time. These particles are able to escape the Sun’s gravity, in part because of the high temperature of the corona,[155] but also because of high kinetic energy that particles gain through a process that is not well understood. The solar wind creates the Heliosphere, a vast bubble in the interstellar medium surrounding the Solar System.[156] Planets require large magnetic fields in order to reduce the ionization of their upper atmosphere by the solar wind.[153] Other phenomena caused by the solar wind include geomagnetic storms that can knock out power grids on Earth,[157] the aurorae such as the Northern Lights,[158] and the plasma tails of comets that always point away from the Sun.[159]

    On other planets

    [edit]

    A towering dust devil on the Martian surface casts a serpentine shadow, illustrating Mars' unique weather conditions.
    dust devil on Mars captured by NASA’s HiRISE camera

    Duration: 40 seconds.0:40Martian wind recorded by the Perseverance rover

    Strong 300 kilometers per hour (190 mph) winds at Venus’s cloud tops circle the planet every four to five Earth days.[160] When the poles of Mars are exposed to sunlight after their winter, the frozen CO2 sublimates, creating significant winds that sweep off the poles as fast as 400 kilometers per hour (250 mph), which subsequently transports large amounts of dust and water vapor over its landscape.[161] Other Martian winds have resulted in cleaning events and dust devils.[162][163] On Jupiter, wind speeds of 100 meters per second (220 mph) are common in zonal jet streams.[164] Saturn’s winds are among the Solar System’s fastest. Cassini–Huygens data indicated peak easterly winds of 375 meters per second (840 mph).[165] On Uranus, northern hemisphere wind speeds reach as high as 240 meters per second (540 mph) near 50 degrees north latitude.[166][167][168] At the cloud tops of Neptune, prevailing winds range in speed from 400 meters per second (890 mph) along the equator to 250 meters per second (560 mph) at the poles.[169] At 70° S latitude on Neptune, a high-speed jet stream travels at a speed of 300 meters per second (670 mph).[170] The fastest wind on any known planet is on HD 80606 b located 190 light years away, where it blows at more than 11,000 mph or 5 km/s.[171]